
Numbers drive decisions, whether it's a salary bump or changes in school grades. For podcast creators, data analytics are key to understanding how well your show is doing and how to better engage your audience. Hubhopper gives you a powerful data analytics dashboard that brings together all your podcast performance data, no matter where it's distributed.
With the Hubhopper dashboard, you can check your:
-
Podcast’s performance
-
Episode Performance
-
Unique listeners
-
Audience’s location
-
Platform-wise data break-up
-
Device distribution
- Video Podcast Analytics
This article will help you decode your data analytics, making it easier to understand and use the information to grow your audience.
Moreover, here are a few terms that will help you better understand your data:
Listens
Listens is the number of time someone taps the play button on any of your episode. For example, one person may hit play on two episodes, that will be counted as 2 listens.
Streams
Commonly referred to as Downloads, Streams refers to someone who listened to your podcast for more than 60 seconds in 24 hours. For example, one person may listen to your episode more than a minute today, and they listen to the same or some other episode for more than a minute tomorrow, that will be counted as 2 streams.
Unique Listeners
When a unique person gives you one listen or stream in some date range (you can choose this in the Unique Listeners tab), it will counted as one.
Hubhopper data analytics dashboard overview
The Hubhopper dashboard has different tabs to help you access and understand your data better. The data is real-time and data from Spotify takes some time to reflect on your analytics, so be mindful of that. Moreover, the metrics you can access differs according to your plan. Here’s what you get with each plan:
Basic Plan (Free)
With the free Basic plan, you can:
-
Check your podcast’s performance
-
Compare episodes
-
See unique listeners
- Audience’s location
Paid Plans
With the paid plans, you get everything in the Basic plan, plus:
-
Platform-wise data break-up
-
Device distribution
-
The ability to export/download your data
-
Add 3rd-party prefixes to your data dashboard
- Youtube Video Podcast Analytics
Here’s a breakdown of these data statistics, what they mean, and how you can use them to your advantage.
Please note that Spotify data is not included in the device breakdown and hourly performance metrics. To access this information, please visit your Spotify account. Here’s how to do it.
Podcast's Performance
The Podcast Performance tab gives you information about your podcast's streams and listens for a chosen date range. You can view data for the last 30 days, 3 months, 6 months, or all time. You can also toggle between streams and listens to see your data. Plus, you can decide if you want to see data for all episodes or just specific ones.
The Streams screen shows you how many unique people listened to an episode for more than 60 seconds within the date range you selected. You'll also see the percentage change in streams compared to the previous period.
The graph shows how your podcast's streams are distributed over your chosen date range, giving you a clear picture of your podcast's performance.

How to Use This Data?
- Track Episode Performance: See which episodes you released during the date range and how they affected your streams and listens.
- Get an Overview: Get a bird’s eye view of your podcast’s performance over time.
-
Identify Trends:
- If your numbers are dropping, it might be time to rethink your content strategy and go back to what worked before.
- If your numbers are rising, keep doing what you’re doing!
- Set Goals: Aim to improve your numbers month over month by drawing insights from your data.
- Timing Matters: Experiment with release times and days to find the best schedule for your audience.
The goal is to keep improving and making your podcast better with each episode by using the insights from your data.
3rd Party Prefixes
At the bottom of the podcast performance dashboard, you can add a 3rd party prefix like Podtrac or Chartable. A Prefix URL is a trackable link that's added directly to your podcast’s RSS feed. This allows third-party services, like Chartable, Podsights, and Podtrac, to track all download requests from your show’s RSS feed.
These prefixes help you see the chart rankings of your podcast, giving you more insights into how your show is performing.
Episode Performance
Episode Performance lets you compare up to five episodes at once. You get data starting from the day each episode was published. You can toggle between streams and listens to see both metrics. Plus, you can view the data for the first 7, 15, 30, or 60 days.
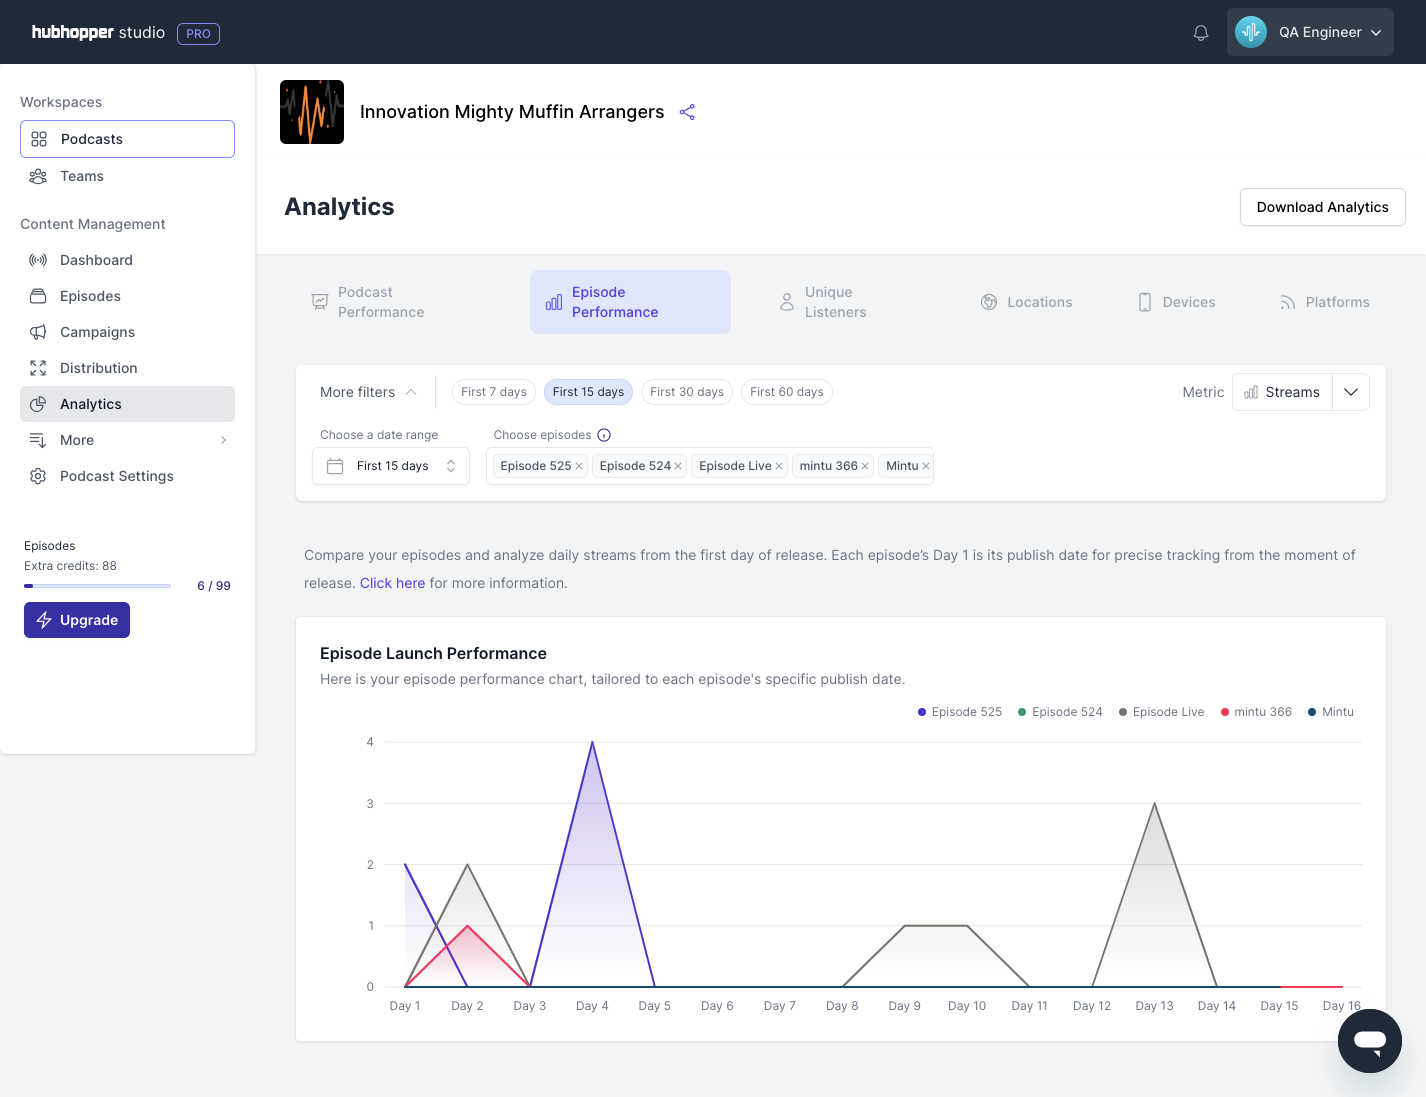
How to use this metric?
Understand Listener Preferences:
- Check if an episode got more listens on the day it was published.
- See if your podcast gets more listens on weekdays versus weekends.
- Determine if a change in format has affected the number of listens.
Identify and Address Dips:
- Notice any dips in listens and streams and promote your episodes during these times to boost engagement.
- For example, if you see a decline on days 5, 6, 7, and 8, schedule promotions to revive interest.
Experiment and Tweak:
- If there's no clear trend, tweak different elements and compare the performance of various episodes.
Boost Audience Engagement:
- Pay attention to what content resonates most with your listeners and create more of that.
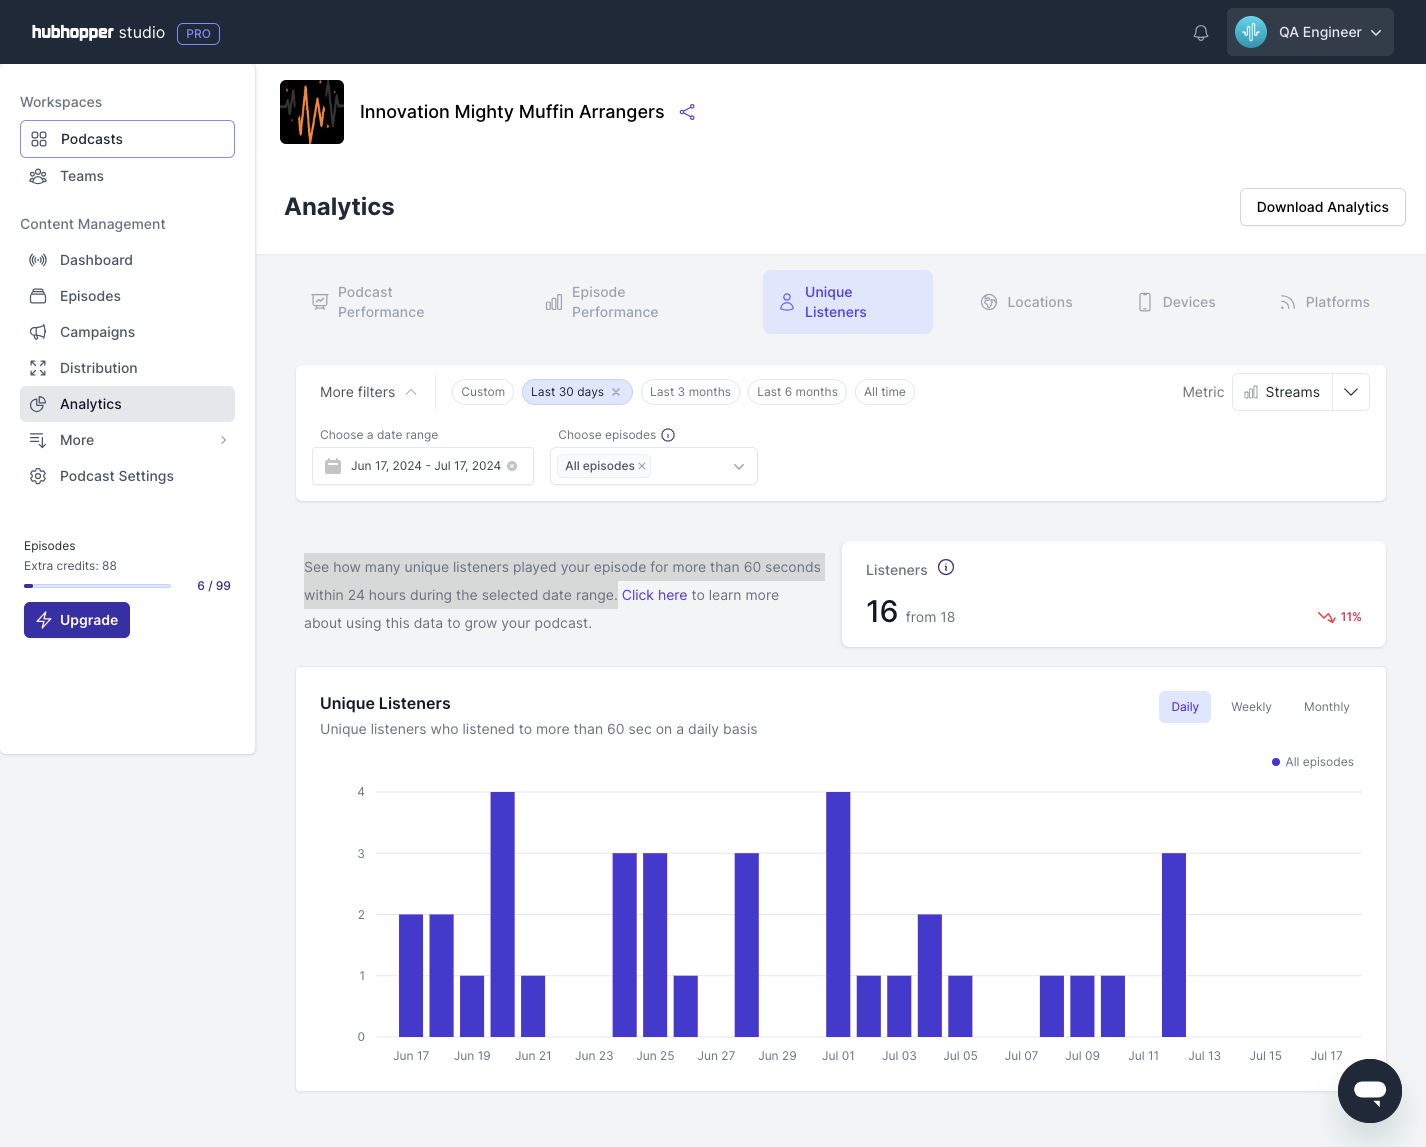
Unique Listeners
This tab shows you the data for your unique listeners, both for the overall date range and in a detailed breakdown. Keep in mind that the graph numbers might not add up to the total because they represent different things.
You can toggle between streams and listens, each giving you different insights:
- Streams: Usually a stronger indicator of audience loyalty.
- Listens: Indicates a wider reach and more people finding your podcast.
You can select up to five episodes at a time to see your unique listeners, or you can view the data for all your episodes.
How to use the data?
Analyze Least Listened Episodes:
- Check out your episodes with the lowest listenership and figure out why they didn’t perform well.
-
Ask yourself:
- Was the intro engaging enough?
- Was the sound quality poor?
- Did you prepare enough and frame the episode well for new listeners?
- Was the episode topic overrated?
Analyze Most Listened Episodes:
- Look at your episodes with the highest listenership and understand what made them successful.
-
Ask yourself:
- Was it due to a guest appearance?
- Did the fresh perspective make it unique?
- Did you try a different podcast format that worked?
Spot Patterns and Anomalies:
- Identify patterns and anomalies in your episodes to better understand your audience.
- Use these insights to plan future episodes and improve your podcast.
Evaluate Changes:
- See if the changes you implemented appealed to your unique listeners.
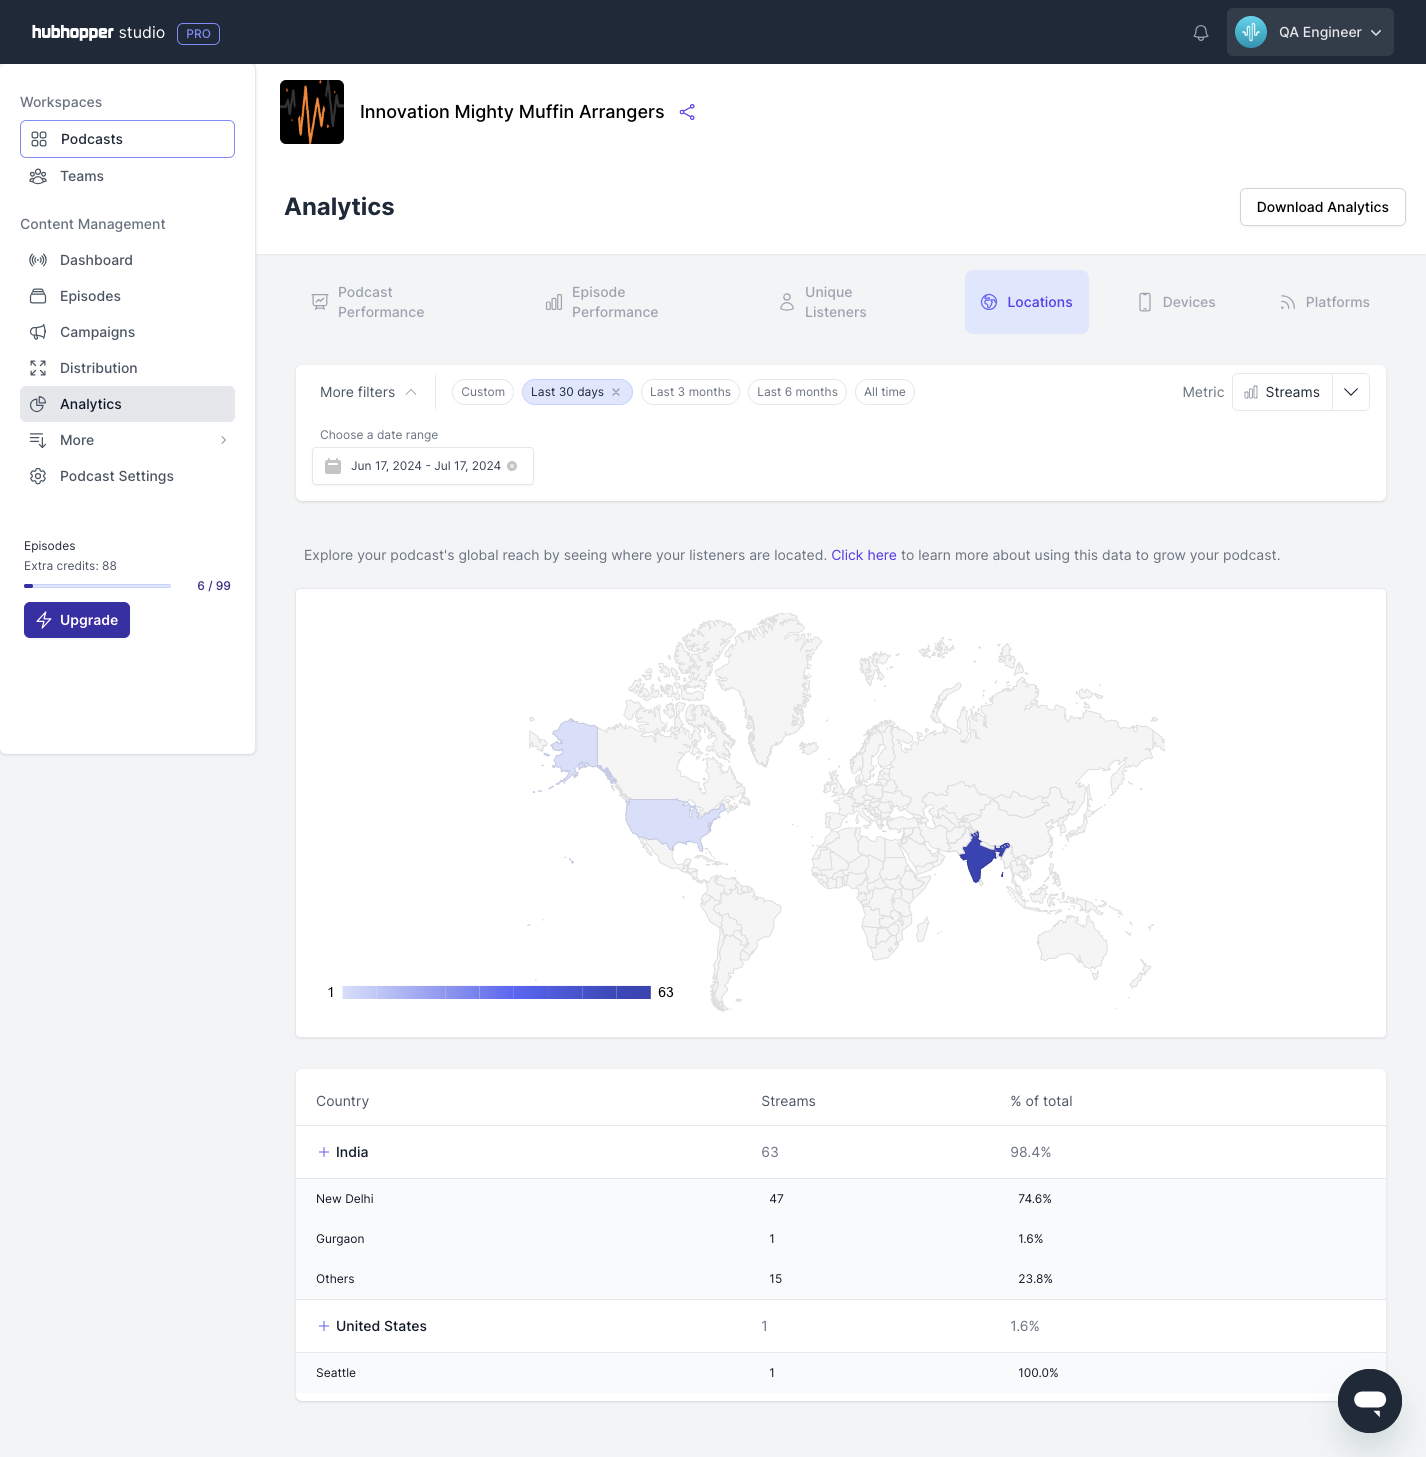
Locations
The Location data shows you the top countries where your podcast is most popular. With this analytics feature, you can see exactly where your audience is coming from. By clicking on the plus sign next to the countries, you can expand the view to see the top five cities in each country that listen to your podcast. You can also adjust the date range and switch between data for streams and listens to get a more detailed understanding of your audience's location.
How to use this data?
Create Targeted Content:
- Familiarize yourself with the top cities where your podcast is popular to create special episodes that resonate with these listeners.
- This makes your content more relatable and increases engagement.
Host Community Events:
- Consider hosting events in these top cities to foster a stronger connection with your podcast community.
- This can help grow your listener base and deepen listener engagement.
Attract Sponsors:
- Use this geographical data to demonstrate to potential sponsors where your audience is located.
- This information can be valuable in negotiating sponsorship deals, especially if sponsors are targeting specific regions.
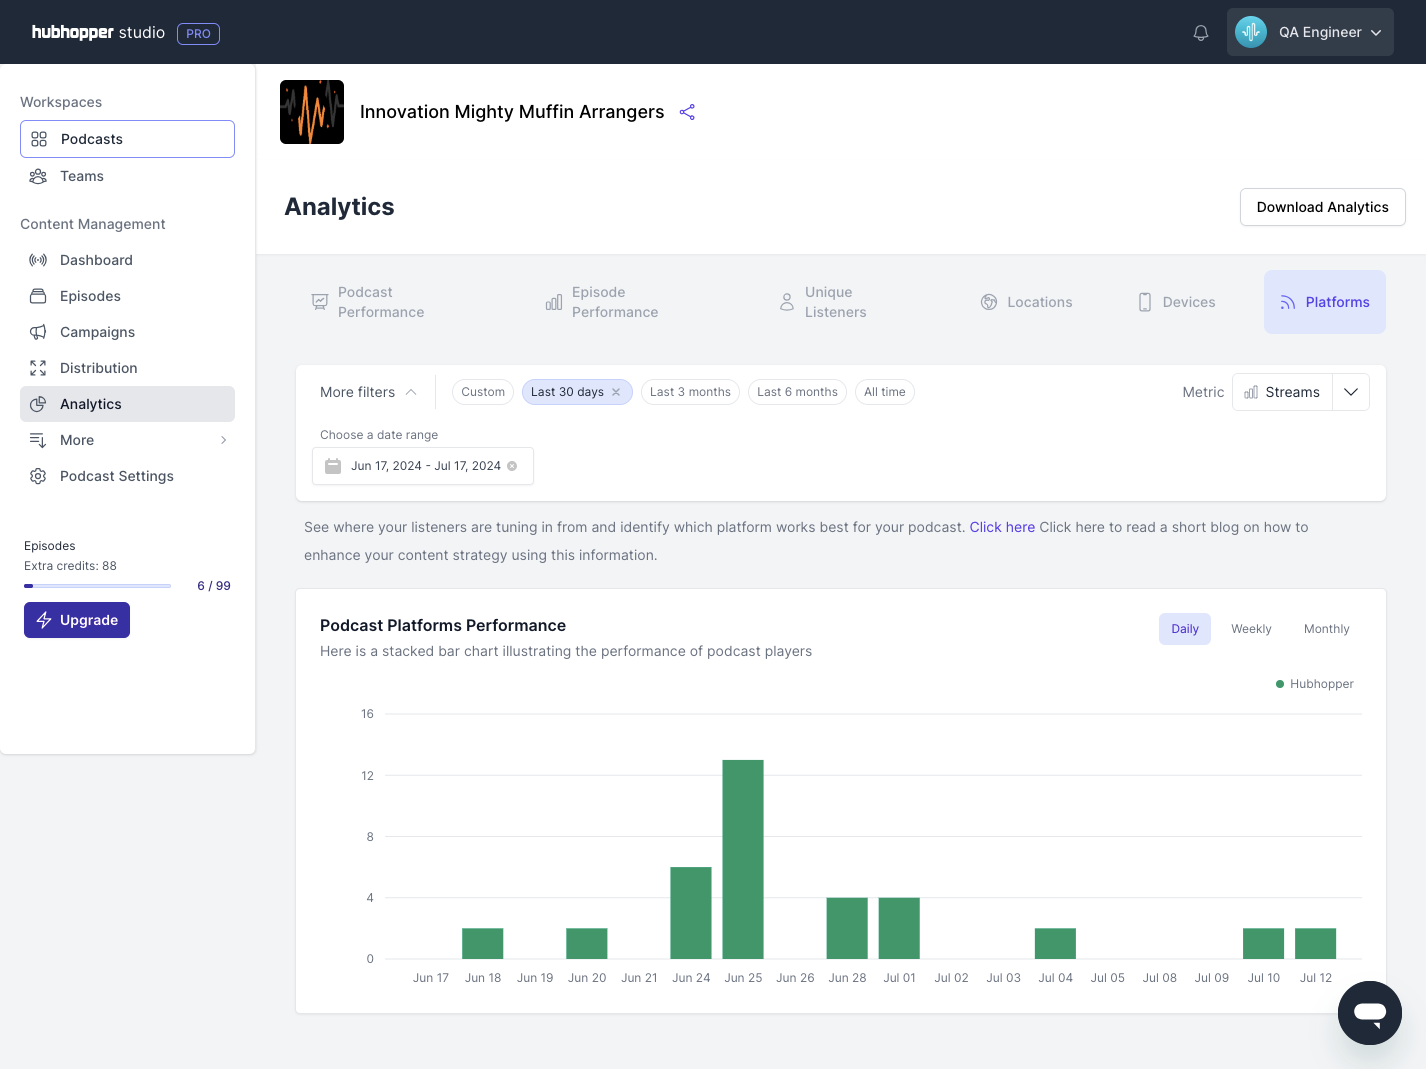
This dashboard provides a breakdown of your podcast's performance across different platforms, showing which platform contributes the most streams or listens. You can switch between viewing streams or listens for each platform.
Please note that Spotify analytics have a 48-hour delay in reporting to us. This means you'll see Spotify data updated with a 2-day delay.
How to use this data?
- Understand Listener Locations: Track where your listeners are tuning in from and monitor changes over time.
- Ensure Platform Diversity: Avoid relying too heavily on one platform to maintain stability, especially considering potential algorithm changes.
- Engage Your Audience: Give shoutouts to listeners on the most popular platform to make them feel valued and connected.
- Inform Sponsors: Share platform data with sponsors to provide insights into your audience demographics and engagement.
- Strategic Focus: Use the data to focus efforts on platforms where listenership is lower while maintaining strong performance on popular platforms.
- Monitor Effectiveness: Track changes over time to see if your strategies are improving listener engagement across platforms.
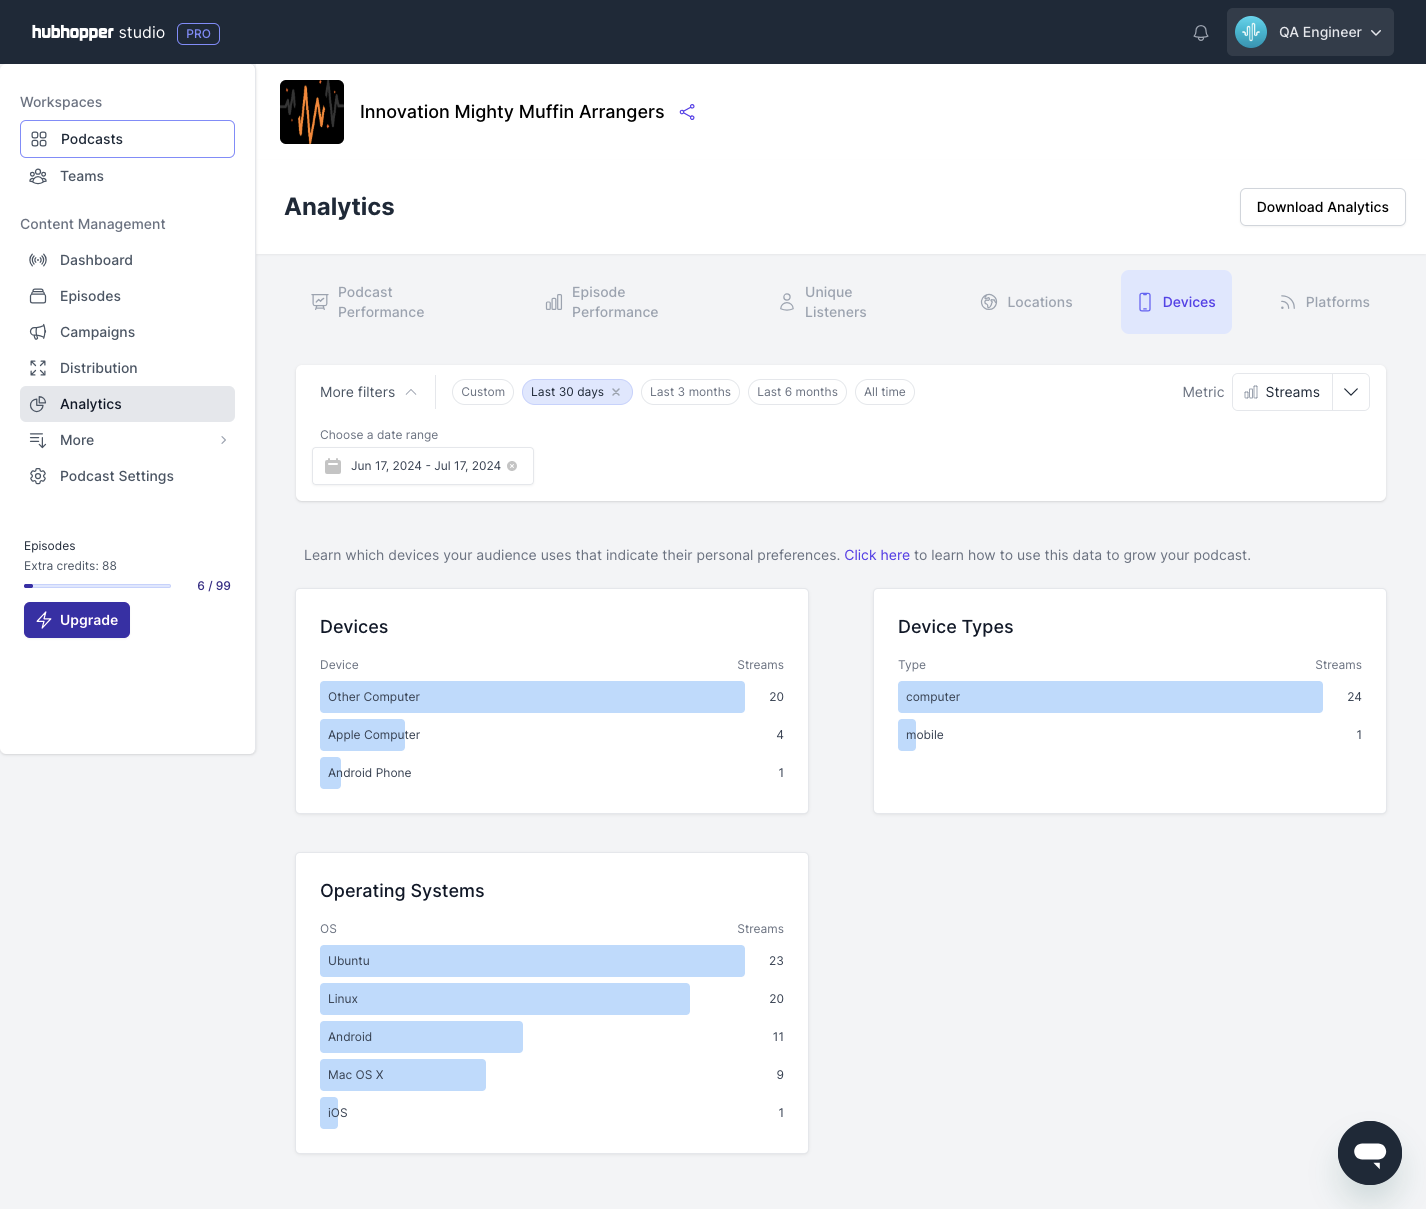
Device Distribution
You can also explore the devices, device types, and operating systems. This feature allows you to select a custom date range and switch between streams and listens data. Understanding which devices your audience prefers can provide valuable insights into their behavior and preferences.
Video Podcast Analytics
You can track the performance of your video podcast episodes directly from your Hubhopper analytics dashboard. This is the only dashboard that will display video-specific data, while all other analytics sections will focus solely on your audio podcast metrics.
Views – The total number of times your video has been played, as fetched from YouTube Analytics.
Please note that, as per YouTube’s system, it may take up to 72 hours for your video analytics to appear on the dashboard.
For more detailed insights into your video podcast performance, we recommend checking your YouTube Studio dashboard.
How to use this data?
- Optimize your podcast's audio quality to suit the devices most commonly used by your listeners.
- Ensure compatibility with popular platforms and devices to reach a broader audience.
- Tailor your marketing and promotional strategies based on how your audience accesses your content.
- Use this information to attract potential sponsors interested in targeting specific device users or demographics.
We hope that the updated Hubhopper data analytics dashboard will help you track your podcast growth and understand your podcast and audience better. Head over to your Hubhopper dashboard to explore your updated podcast data analytics.
Comments
0 comments
Please sign in to leave a comment.